Why multi strategy systematic?
Introduction to systematic
As Marx highlighted, capitalism is based on creative destruction. One person’s demise is another’s opportunity. The world of alternatives has always been thus. The current boom in private lending is a direct result of the banking industry’s woes during the GFC. Looking further back at history, the demise of LTCM in 1998 allowed the creation of several later “stars”, as did the demise of both Tiger AM and Soros in the early 2000s. Both periods felt like the “end of hedge funds” but were, in reality, a pause for breath as new stars emerged. Progress has never stopped within the hedge fund subset of alternatives: from single strategy discretionary to multi-strategy discretionary and the rise of platform funds.
Our view is that the 2018-2020 period is the pause before the continued progress from single strategy systematic strategies (e.g. CTAs or quant equity market neutral funds) towards a world of multi-strategy systematic funds. Perhaps the next step will be multi strategy quantamental strategies, for want of a better word. The challenging market landscape in 2020 has been markedly different to the one observed by quantitative strategies over the past 30 years. This has led to widespread investor redemptions from the quant giants leading to an “unwind” of systematic strategies across the board. But the sources of these strategies remain intact. Investors still have behavioural biases, markets still have structural inefficiencies and the appetite to surf momentum, to capture spread, and to hedge is still present. Once the selling stops, these forces, and the returns they offer, will return. And just in time. Because if the world again “follows” Japan, first ultra-low rates and then a world of zero diversification benefit between bonds and equities, then we will need appropriately priced alternatives to fill this portfolio function.
Summary points
- Traditionally defensive allocations to treasuries and investment grade (“IG”) bonds offer very little yield, little upside in risk-off environments, significantly reduced diversification, and a slow bleed if inflation returns.
- Strategic Asset Allocation, now more than ever, requires a focus on strategies that can deliver positive returns over time but more importantly can be defensive in nature (low correlation) – equivalent to a dynamic midfield of a football team.
- Alternative investments offer investors a wide range of exposures to alternative betas, as well as alpha, that are diversifying to both stocks and bonds over the long term.
- Some of the alternative betas have been commoditised and are being offered in fee-efficient liquid alterative risk premia strategies (“ARP”).
- Whilst 2016 and 2017 were good years for alterative risk premia, 2018 and in particular 2020 were not, which has made the ARP industry face an existential threat after a period of large inflows.
- The ARP space is not homogenous and the dispersion in returns has been significant with factors like size of AUM, universe of instruments traded, quality and speed of signals, portfolio construction and risk management explaining a large part of this dispersion.
- Redemptions from this space have compounded the losses. As the outflows from such strategies stabilise, so should returns.
- Before investors give up on ARP, they should consider if the poor returns are due to poorly constructed risk premia or liquidation and/or fundamental shifts in the market that challenge the very existence of risk premia.
- We believe that the main risk premia drivers, namely behavioural biases, structural inefficiencies and risk sharing are still prevalent.
- Investors should carefully consider how best to build a well-rounded allocation to this space, perhaps considering a multi-manager approach diversifying across the key drivers such as the size of the AUM, universe traded, signals used, portfolio construction and risk management.
- Robustly constructed risk premia allocations have a role as a dynamic, fee-efficient, transparent and liquid alternative exposure within a strategic asset allocation framework.
Successful Strategic Asset Allocation
Successful Strategic Asset Allocation (‘SAA’) can be similar to building a cohesive football team. You need attack, midfield, defence, and a goalkeeper. The key is to have a diversified portfolio that can “score” (or generate returns) in a variety of scenarios, but that can also “defend” during adverse market conditions.
The optimal attacking line-up has shifted over time. Historically, developed market equities, particularly US equities, have been a consistent centre-forward for portfolios. Emerging markets were a formidable striker in the 2000s but have failed to score in the 2010s. Value and growth have followed a similar evolving pattern of leadership. Like football, attack is the area most investors focus on and superior performance can be achieved over time through a diversified line-up that tilts the mix across the liquidity spectrum (public and private markets), asset classes (commodities and equities), regions (developed and emerging markets), sectors (cyclical and defensives) etc.
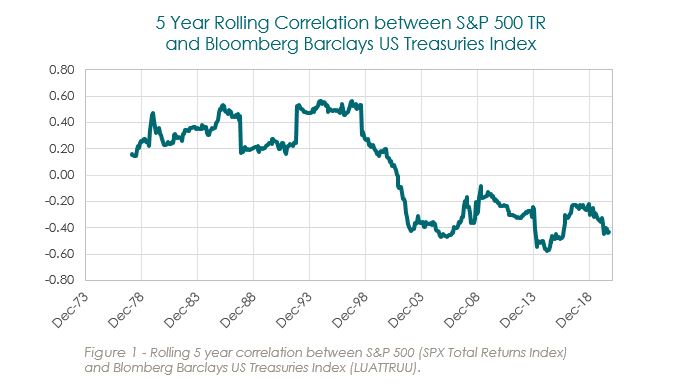
The attacking part of the portfolio has attracted most of the attention, in part because US Treasuries have been a reliable “centre-back” over the last 40 years. This cornerstone of defence has delivered positive carry (as yields were substantial), price appreciation (as interest rates fell over time) and diversification to the attacking line-up (as rates fell during risk off environments). Since the September 1981 highs in the US 10-year yield, US Treasuries have delivered 7.45% p.a.[1], and have protected portfolios by delivering positive returns during 38 of the 50 worst months for the S&P 500.
September 2020 was therefore a rare month in recent financial market history. The S&P 500 fell by over 6% from the 2 September highs through to the end of the month. However, a traditional defensive line-up would not have helped. In the same period, US Treasuries returned -0.22%[2], IG Bonds lost -0.41%[3], Gold lost -2.34% and even the VIX fell by -0.75%.
Even the newest “defensive strategies” would have compounded the losses. The Nasdaq 100 fell -8.07%, as did large cap tech companies (-6.22% for the NYFANG index) and Bitcoin lost -5.88%. Hopefully, as the frothiness in the market dissipates (and the uncertainty around COVID-19, US elections, and geopolitics is reduced), “normal” market relationships will return.
The defence provided by US Treasuries within an SAA portfolio, an anchor on which investors have learned to rely over the past 20 years, will most likely not act as a meaningful diversifier for years to come.
At yields of approximately 0.8%, US 10-year Treasuries offer very little yield, little upside if rates go to 0% and hence significantly reduced diversification to equities, and a slow bleed if inflation returns. This holds in an environment where the US Federal Reserve Board (‘FED’) is not “even thinking about thinking about raising rates”. In a rising interest rate environment, the current yield is too little to compensate for potential losses.
Investors should not be surprised.
- In the period from January 2000 to September 2020, the correlation of monthly returns
between stocks and bonds was -0.35. - In the period January 1973 to December 1999, this correlation stood at +0.27 (see Figure 1).
Japanese investors have become accustomed to this lack of diversification for quite some time. In Q1 2020, investors in the Nikkei 225 (“NKY”) lost -19.25% (in JPY). If investors were “hedging” using bonds, these losses would have been compounded, by a loss of -0.35% in Japanese IG Bonds (in JPY)[4]. JGB 10Y yields stood at -0.11% at the end of 2019 and ended Q1 2020 at 0.027%. In the period Q3 2000 – Q1 2003, when the NKY drew down by -53%, Japanese IG bonds were up +9.5%, (as yields on the JGB 10Y compressed from 1.76% to 0.71%).
German investors are learning a similar lesson. In the period from 7 July 2011 to 12 September 2011, at the peak of the EU debt crisis, the DAX lost -32.11% and German Treasuries[5] delivered +7.8%, as yields compressed from 2.97% to 1.74%. Between 19 February and 18 March 2020, the DAX lost -38.8% and German Treasuries lost -0.49%.
The lower the yields are at the start of an equity correction, the less they can compress and provide convexity to a fixed income diversifying position. Given the current level of interest rates available on developed market sovereign bonds, investors must adapt to the fact that Treasuries and IG bonds more generally, may no longer provide meaningful defence, i.e. steady returns and diversification.
This new environment requires investors to focus on their midfield. Until the global financial crisis (the ‘GFC’), investors had been expanding their allocations to alternative investments to “maintain possession of the ball”: namely the ability to generate returns during normal market conditions as well as in crisis periods. These “midfielders” (aka hedge funds) were expensive (in terms of fees) and came with longer term contracts (in the shape of longer liquidity terms, lock-ups, and gates).
This midfield line-up of alternative investments could attack, by providing equity like returns, as well as defend, by delivering bond like diversification (delivering positive returns in the 2000-2002 bear market). The GFC, however, confirmed what academic researchers had been claiming for some time: namely that alternative investment managers did not solely generate alpha but that a significant proportion of active returns could be explained by Alternative Risk Premia (see Figure 2)[6].
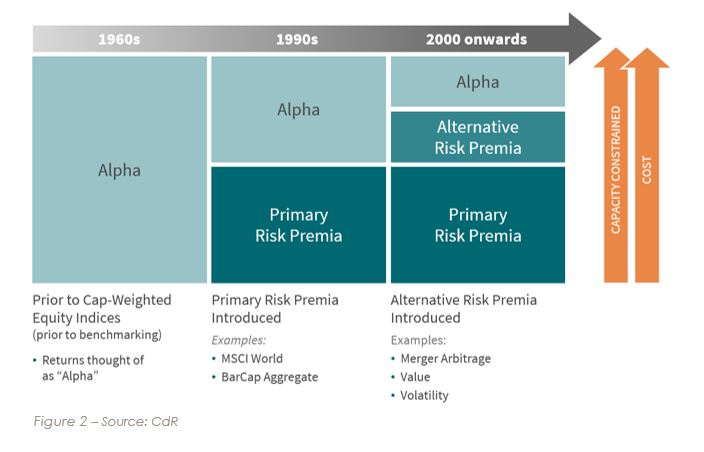
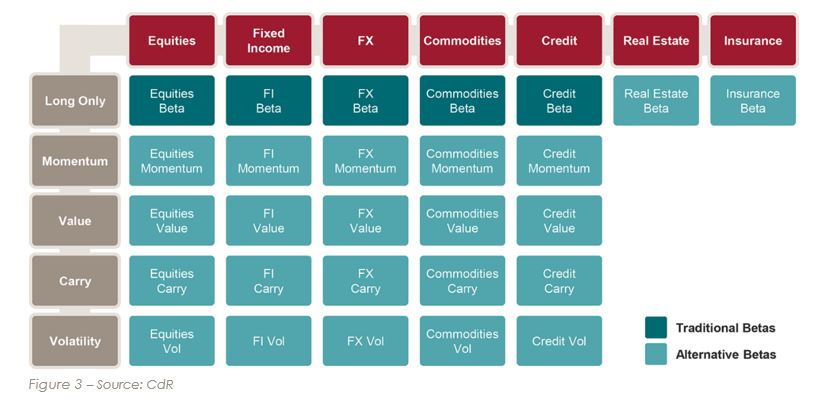
Alternative Risk Premia are systematic sources of return that go beyond the traditional equity and bond beta. These alternative “betas” can be found across asset classes and be broadly grouped into the following categories (see Figure 3):
- Long Only (Traditional Betas) – Investors profit when a security price goes up
- Momentum – Investors profit when a security price goes up or down in a persistent fashion
- Value/Mean Reversion – Investors profit when a security price turns (up or down)
- Carry – Investors profit when a security price is stable (‘clip the coupon’)
- Volatility – Investors profit when a security’s realised volatility is low
In recent years, many Alternative Risk Premia (such as trend following and merger arbitrage) which were previously only available in a hedge fund format, were commoditised and offered in liquid, fee-efficient vehicles that systematically harvested these alternative strategies. For example, in 1999, investors wanting access to trend-following strategies had to pay an average 2% management fee and 20% performance fee[7] since this risk premium was only accessible through investments in CTAs. Today, such a strategy is available on a flat fee basis in a variety of different vehicles ranging from funds to swaps.
Alternative Risk Premia strategies have gained increasing investor attention since 2015, reaching an industry level AUM of $794bn as of June 2020, up from $400bn in December 2016[8].
Investors believed that they could substitute the opaque, expensive, and illiquid “midfielders” with such strategies that offered full transparency, better liquidity and fixed fees. The trade-off between liquidity, fees and alpha was worth it, and in 2016-2017, risk premia strategies delivered diversification as well as returns consistent with the more expensive hedge funds.
However, 2018, and particularly 2020, have not been good years for risk premia strategies. As of 30 September 2020, the SG Multi Alternative Risk Premia Index (“Risk Premia Benchmark”) was down -13.1% year to date[9] as compared to +0.46% for the HFRI Fund Weighted Index (“HF Benchmark”) and +2.12% for the MSCI World TR Gross Index (“Equities Benchmark”). In Q1 2020, the Risk Premia Benchmark provided some defence, like hedge funds, delivering -8.66% vs -11.55% for the HF Benchmark and -20.93% for the Equities Benchmark. US Treasuries in the same quarter were up 8.90% while IG Bonds were down -0.33%.
But in Q2 and Q3 2020, risk premia strategies continued to bleed (-4.92%), as they missed out on the sharp equity rally (+29.16% for the MSCI World[10]) and lagging hedge funds (+9.1% for the HFRX Global[11]), while US Treasuries were flat at +0.65% and IG bonds were up 6.07%.
The losses in Q1, and the failure to capture the rebound, have led several investors to question the role risk premia can play in a portfolio, and the validity of quantitative strategies in general, in this environment of government and central bank intervention.
Assets in the risk premia space have decreased by -12% from December 2019 to June 2020, on a like-for-like basis[12]. The press suggests that the risk premia industry is facing an existential threat[13] following disappointing returns in 2018 and 2020.
However, before investors make the final decision on Alternative Risk Premia (with two datapoints of significance, namely 2018 and 2020), it is worth bearing in mind the following:
- The 2020 year-to-date (‘YTD) dispersion of risk premia product performance is large. Not all risk premia strategies suffered large losses, and this dispersion can be largely explained by:
- The size of the manager’s AUM
- The strategies employed
- The universe of instruments traded
- Strategy construction and signals used
- The portfolio construction, risk management and rebalancing frequency
- Large outflows from systematic investing strategies compounded the losses
- The fundamental reasons of existence of most risk premia has not changed
Dispersion
Risk premia is an industry still in its infancy. It is therefore expected that there will be misunderstandings as to what risk premia investing can deliver in terms of performance, due to unrealistic expectations built on data mining, unrealistic expectations on trading cost, and the effect of crowding once a factor has been discovered[14]. Moreover, a balanced risk premia portfolio is not necessarily one that incorporates as many risk premia as possible. Naive risk management tools based on historical performance neglect the dynamic nature of these strategies.
Diversification across different types of risk premia is key since these strategies can be more or less aggressive in terms of their exposures to risk-on and risk-off events. Investors should not believe that simply adding an additional risk premium in a different asset class will lead to increased diversification. This is particularly relevant in periods of market stress, where diversification can disappear, and positioning is all that matters.
An understanding of how factors behave in different regimes is required. Not all risk premia strategies lost money in March 2020. Strategies like Long Short Equity Quality, Fixed Income Value, FX Value, Commodities Curve Carry are, by their nature, defensive as they often take positions that are opposing to risk-on strategies[15]. Attacking, or risk-on, strategies like Volatility Risk Premia, Credit Carry, Dividend Arbitrage, Long Short Equity Size and Value and FX Carry as expected lost money. Adaptive strategies, more like a dynamic midfield, lost money in some cases (e.g. Equity Trend) or made money in others (e.g. FX Trend). The mix of strategies and their relative weights can help explain the dispersion in returns in 2020.
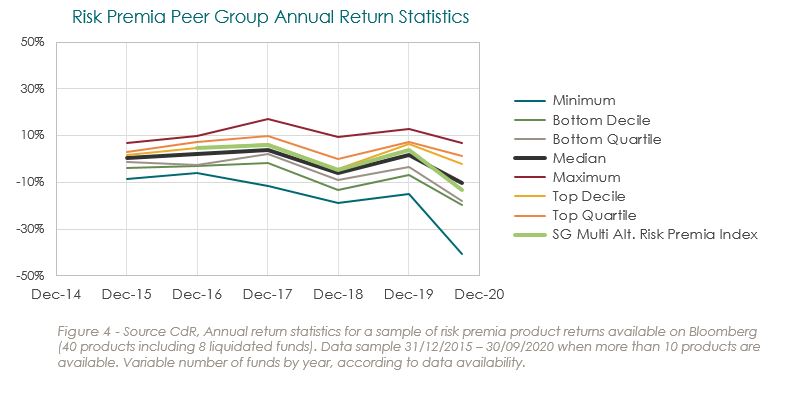
As seen in Figure 4, the YTD returns of 40 risk premia products, including 8 that have been liquidated, display a remarkable dispersion. The worst performing product, liquidated in July 2020, is down -40.6%, while the best performing fund delivered +6.79%. The difference between the top and bottom quartile of performance is an astonishing 20%. In 2018, another bad year when the index lost -4.68%, the difference between the top and bottom quartile was 8.9%. This dispersion suggests that “alternative risk premia strategy” is a very widely defined group that contains products with significant differences in size, universe, risk premia implementations, signals, portfolio construction and risk management.
Size Matters
If you were to look at public data on AUM vs returns, it implies that the larger managers in the space lost more money in the first 4 months of the year than their smaller counterparts. This may not be solely the result of the adverse impact of size on trading but may be linked to the types of markets these larger strategies focus on, the way they construct their signals, the portfolio construction and the rebalancing frequency.
Universe Matters
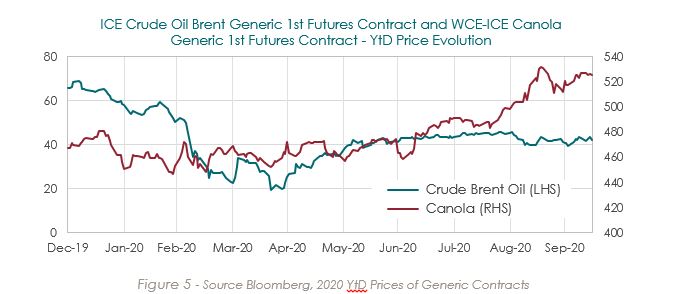
Strategies that target significant capacity have to focus on the most liquid markets in the world in terms of macro premia (usually 50-75 markets across equity, FI, FX, credit and commodity futures, forwards and swaps), and the most liquid stocks in terms of equity premia (usually the 1,500 most liquid equities represented in the MSCI World). These instruments are widely held by financial investors and tend to be liquidated “en-masse” during extreme risk-off environments like the one we saw in March 2020. For example, oil prices are much more correlated to global growth than Canola prices (see Figure 5).
Signals Matter
Quantitative investing is fraught with spurious relationships and over-reliance on data-driven approaches on one side or the pursuit of academic purity on the other. Both extreme approaches lead to solutions that appear to make money in a back-test but fail to deliver the desired exposures and returns when implemented out-of-sample.
There are several ways to harvest a risk premium. Managers must adapt their signals for real world implementation and must take into account real life application, market dynamics and execution costs. This is particularly relevant when examining academic back tests of strategies.
Many investors are lamenting the death of value investing in equities. An implementation of the original academic definition of the value factor (Book Value to Price) would have delivered a drawdown of -57.5% from March 2007 to August 2020[16]. Does this mean that value investing is dead or that the definition of value should be revisited in a world where patents and intellectual property matter more than industrial equipment and buildings[17]? Should value have a consistent definition across sectors?
Even in a risk premium as commonly accepted as trend following, should short term mean reversion and trend over-extension be considered, and should managers stick to a single set of frequencies that has backtested well over the last 30 years for the sake of simplicity and explainability?
And what of carry in a world of very low interest rates and very low growth? Should managers pursue a particular return and volatility target, therefore over-leveraging strategies where spreads are lower than they were in the backtest? Should investors apply a carry strategy to all instruments in their universe “for academic consistency” even if there is no fundamental reason for the existence of a risk premium?
One of the main attractions of risk premia strategies is full transparency. Investors in such strategies should fully understand and appreciate the types of exposures they are getting and the way their portfolio exposures will evolve in a given market scenario rather than simple monthly data dumps of portfolio information.
Yes, the YTD return of many risk premia strategies is disappointing. But given the speed of the market correction in February and March of 2020, after a bullish 2019, and the sharp recovery, should it be a surprise that medium term trend following was caught wrong-footed and has lost money, particularly in equities? Probably not. Should investors swap out their entire trend following exposure from medium/long term trend, that would have done well in “normal” bear markets like 2000 and 2008, to shorter term trend, that may not provide the drawdown diversification during long drawn-out market corrections like 2000 and 2008? Again, probably not. Investors should understand and accept that dynamic strategies will be positioned risk-on or risk-off in certain environments.
Similarly, should investors never touch volatility carry strategies after the 2018 and 2020 harrowing experiences? Probably not. Should investors be weary of overleveraged volatility strategies, that performed really well in 2017, or of strategies that rely on adaptive signals to step out of the market when the going gets rough, that would have done very well in 2008? Probably yes. But strategies that are diversified and harvest a volatility premium across asset classes, where such a premium has a raison-d’être, across time and across strikes, will continue to collect a premium for as long as long only investors have the desire to share their risk for a “fair” price. Of course, there will be the occasional loss when risk-off environments imply that it is time for the insurer to pay out.
Portfolio Construction and Rebalancing Frequencies Matter
Investors analysing the performance of risk premia strategies should use the transparency provided, after all they are systematic and not black box or opaque, to understand what risk premia were being harvested, how the portfolio was put together and when was the portfolio rebalanced.
Risk premia strategies that target very large capacity have to slow down the signals, the execution and the rebalancing frequency in order for the market to be able to digest the size of the trades required by their large AUMs. Several trend following strategy implementations claim that monthly, or even quarterly rebalancing, could yield similar results in a backtest, with a significant increase in capacity. Overtrading can be detrimental to any strategy but particularly in the case of trend following in choppy markets. But a strategy that snaps the market on a regular basis (daily or weekly) has the ability to digest new market information and adjust exposures accordingly, as was the case in February and March of this year. This is not to say that all strategies should rebalance very frequently. But strategies that are based on price information only, should use all available information.
Perhaps the most important determinant of past, and future, performance is the portfolio construction. It is imperative that investors acknowledge the fact that these are dynamic strategies and therefore, solely relying on historical performance, backtested or live, will lead to a gross overestimation of their decorrelated nature.
For example, trend following is widely accepted to be a positive convexity strategy. This is not solely based on historical performance, but rather it is a tautology. As prices go up (down) a trend following strategy will go long (short) the particular market and therefore deliver gains in persistent up or down moves. Such a strategy will be challenged in trendless or choppy markets. Volatility risk premia, on the other hand, will make money when markets go nowhere, as long as the volatility remains within “normal” levels, but will be challenged in environments during which markets move fast in one direction. Historically, and particularly in 2008, these strategies diversified each other, with losses in volatility strategies offset by significant gains in trend following. However, these are dynamic strategies, and in an environment where equities move up with low volatility, like 2017, trend following will enter 2018 long equities. Equity volatility risk premia strategies will also be implicitly long equities via their short (realised) volatility exposure. Investors should not be therefore surprised when both strategies lost money in February 2018, since equities corrected, and volatility spiked.
Portfolio construction, and risk management, should be based on a solid understanding of the sources of returns that are being harvested and of the environments during which they work. The individual risk premia are not absolute return strategies but are alternative betas and therefore they will lose money in given market scenarios.
Large Outflows
Large performance shocks in systematic alternative investments are usually followed by outflows, which like in 2020 compound the losses, and then by lumpy catch-up returns as markets and AUMs re-normalise.
This is not the first, or the last time, that alternative investment strategies have come under fire and their existence questioned for disappointing returns after liquidity events. In 2008, hedge fund returns disappointed investors as positions were liquidated across the board, even though CTAs, a quantitative investment strategy, delivered +14.09% (Barclay CTA index). In 1998, a flight-to-quality in over-leveraged positions led to staggering losses by LTCM and an eventual bail-out. But after the fire-sale event, so long as investors have not over-leveraged their positions, the fundamental relationships re-establish themselves.
For example, between 7 and 9 August 2007, the S&P 500 lost -1.56%. However, several high-profile quantitative long/short equity hedge funds experienced significant losses during these days, in what was later described as a sudden liquidation[18].
The main culprit for these losses was crowding[19] and several investors and news articles questioned the viability of quantitative investment strategies at the time. But quantitative investing did not disappear, in fact it flourished. Strategies that were not stopped-out at the market bottom recovered and have delivered positive returns to investors since this event. In fact, according to Pensions & Investments, as of 30 June 2019, 4 out of the top 5 hedge funds in terms of AUM were quantitatively focused (see Table 1).
|
Rank |
Manager |
Assets (m) |
Change from 2018 |
|
1 |
Bridgewater Associates |
$132,050 |
-0.5% |
|
2 |
Renaissance Technologies |
$68,000 |
19.3% |
|
3 |
Man Group |
$62,000 |
4.9% |
|
4 |
AQR Capital Management |
$60,840 |
-27.3% |
|
5 |
Two Sigma Investments/Advisers |
$42,900 |
10.6% |
Table 1 - Source: Pensions & Investments, September 2019 Special Report
Investors should note that the market dislocation in February and March 2020 did not only affect risk premia strategies but has also hit other systematic hedge funds which follow similar and related strategies.
Losses in these strategies were most likely initially caused by the rush to exit positions in late February and early March, as the impact on the economy of COVID-19 and the subsequent lockdowns, became apparent. Markets such as futures on the S&P 500 and the 10 Year Treasury became increasingly illiquid. With automated risk management systems that de-lever as losses in strategies spike, losses in these decorrelated but leveraged strategies were compounded in Q1. If we add to this the increasing pressure of investor redemptions, which amplify the price effect of closing out of positions particularly for large managers and crowded markets, then perhaps the performance of risk premia strategies in Q1 and since the market bottom on 23 March is partially understandable.
As the outflows from such strategies stabilise, so should returns. It is imperative for investors to ask if the losses incurred in 2020 in their risk premia portfolios were the result of:
- Liquidation, due to risk management and investor redemptions as described above
- Badly constructed risk premia strategies and portfolios
- Fundamental shifts in the market that challenge the very existence of risk premia
Reasons of Existence
It is generally accepted that March 2020 was a liquidation event. HFR researchers noted that the industry's largest hedge fund managers (with assets >$1bn), experienced collective net outflows of $31.7 billion in Q1 2020[20]. As noted previously, a significant proportion of the losses, and their dispersion, can be explained by the size of the AUM, the universe, the signals and the portfolio construction and risk management of a given product.
However, calling 2020 the year that leads to the death of systematic strategies in general, and risk premia products in particular, may be premature.
In general, risk premia can be grouped according to their underlying source of return, and this is perhaps the primary guide as to their expected behaviour in a given market scenario:
- Behavioural
These risk premia are generated from the behaviour of market participants. Momentum is an example of such a risk premium and is caused by the existence of noise traders, and the difference in the timing of investment decisions by market participants. During episodes of euphoria or pessimism, prices will move in a particular direction and investors follow the herd and re-enforce the price moves. Fully informationally efficient markets should not have persistent trends.
- Structural
These risk premia are generated from the organisational set-up of financial markets. For example, commodity carry arises from the way physical commodity markets are structured, which determines the shape of the futures curve for a particular commodity. The prime determinants of the shape of the curve are funding and storage costs, convenience yields, hedging pressure and expected supply-demand imbalances. The interaction of speculators and physical players in these markets give rise to risk premia across commodity sectors that can be harvested, by taking advantage of any convenience yield that is excess to the funding and storage costs. Another example is the low beta factor which can be attributed to the benchmarking of managers to commonly accepted indices, which in turn implies that professional asset managers invest in high beta stocks in order to beat the benchmark, thus neglecting low beta stocks. Finally, given the governance constraints of many institutional investors, high yield bonds are overlooked, thus yielding, on average, an excess return. If all investors have the same utility function then these risk premia will not exist, although others may arise.
- Risk Sharing
These risk premia exist because of the differences in investor utility functions and positioning. These differences force certain investors to transfer a particular risk to other players in the market, for a fee. This fee is the risk premium. For example, since the vast majority of investors tend to be long-biased in their equity holdings, there is a risk premium to be extracted from selling protection against adverse equity market moves, thus harvesting a volatility premium, and “paying out” when the adverse move occurs. Another example is merger arbitrage, whereby long-only asset managers offload the shares of target companies to arbitrageurs as they do not want to take the event risk of the deal closing or not.
Behavioural-based risk premia, for example trend following in equities, were caught wrong-footed both during the March 2020 bear market, and during the subsequent sharp equity recovery. Structural risk premia such as Credit Carry, suffered significant losses in Q1 and have only partially recovered. Finally, risk sharing-based strategies such as Volatility Carry in Equities, compounded the losses during a volatile year.
Risk premia strategies that solely rely on a particular set of sources to generate returns, for example risk sharing, may outperform over the short to medium term. But they are destined to lose money during risk-off environments. Naïve diversification may suggest adding behavioural and structural risk premia to smooth out the expected return. But path dependency is key, since, if a crash occurs after a period of euphoria, behavioural premia will be hurt, as most investors will have anchored beliefs that the good times will continue to persist, and some structural premia, such as credit carry, will also be hurt as the markets digest the increased probabilities of default.
The recent experience in risk premia investing does not imply that the fundamental sources of returns have disappeared.
Market participants still have behavioural biases, market information is still not digested equally or at the same time (even if technology has made information accessible to all, at the same time), and investment committees are still not all held at the same time. This implies that flows will continue to make their way into financial markets at different speeds and therefore trend following and momentum, a strategy that has been in existence for at least 200 years[21], should continue to deliver positive returns. Moreover, even though the structure of the market is evolving, there are still inefficiencies generated by the wide variety of rules, regulations, restrictions and investor utility functions. Structural premia, such as carry will continue to generate positive returns. This is particularly the case in a world where investment banking prop desks have all but disappeared. Finally, the nature and size of institutional investor portfolios, and their need for high expected returns, suggests that there is a continued need for insurance, which implies that risk sharing premia will continue to exist.
Investors should understand the inter-connectivity and the potential for such dynamic strategies to take similar positions in a particular market environment and diversify by harvesting premia from different sources, in a variety of markets, both traditional and esoteric, using robust, fundamentally grounded signals. And if the AUM tracking such strategies is now lower than before Q1 2020 then this suggests that the risk premia space is now less crowded.
Role of Risk Premia in SAA Portfolio
It is our belief that the risk premia space has seen, in the period 2018-2020, its first, but not last, crisis of confidence. Even though risk premia are expected to generate positive returns in the future, investors find it difficult to understand where to place them in a SAA framework.
Robustly constructed portfolios of risk premia cannot deliver the expected returns of a pure attacking line-up, such as emerging market assets, during a strong economic recovery scenario. But investors should also be weary of treating them as goal-keepers, given that they are not a hedge (hedges pay the risk premium of insurance, they do not receive it since that would be a free lunch).
Investors in risk premia strategies should treat them for what they are: a liquid, fee efficient and transparent exposure to alternative sources of returns. Risk premia is a dynamic midfield player in investors’ portfolios (see Table 2).
|
D |
Dynamic exposures. Risk premia are passive allocations to dynamic strategies. |
|
Y |
Yield positive returns over time. Risk premia are compensation for taking risks in financial markets. |
|
N |
Non correlated. They are by construction long-short or dynamically directional allocations to traditional markets. |
|
A |
Alternative betas. Unlike smart beta, they offer pure exposures to alternative sources of returns. |
|
M |
Methodical and systematic strategies. They are less susceptible to the psychological biases |
|
I |
Identifiable and observable sources of returns. Risk premia offer exposure to academically |
|
C |
Clear and transparent implementation. Risk premia strategies are transparent in their construction |
|
M |
Multi Asset-Class. They are diversified by harvesting multiple risk premia across multiple asset classes |
|
I |
Intuitive application of theory to practice. Implemented strategies should incorporate logical |
|
D |
Diversified Multi-Premia exposures across a variety of returns sources. |
|
F |
Fee efficient. They offer a flat fee exposure to alternative investment strategies. |
|
I |
Iterative research and evolution of strategies to adapt strategies for real-life application of |
|
E |
Explainable. Unlike data-driven quantitative investing methods, risk premia strategies should harvest |
|
L |
Liquid. This is a key differentiator to other forms of alternatives. |
|
D |
Defensive allocations without over-reliance on what has worked in the recent past. |
Table 2 – Source: CdR
Dynamic midfield players should defend well, attack when appropriate and deliver positive returns on average.
Trend following and other risk-on strategies like volatility carry will tilt any risk premia allocation to a more attacking formation when markets are persistently moving higher. Conversely, as markets move lower in a persistent fashion, trend following strategies can deliver defence as they did in 2000 and 2008. Carry strategies, depending on their nature should provide positive returns as long as markets stay “normal”. Finally, an allocation to more defensive premia like FX Value, may detract from performance in strong risk-on environments, but should deliver during risk-off environments, even as violent as the one we saw in Q1 2020.
Investors should also expand their search for risk premia in less well-trodden markets, such as emerging markets or esoteric commodities. Such markets have fewer financial participants and are therefore less affected by liquidation events, even though they may suffer from idiosyncratic events.
Lastly, investors should ensure that they are genuinely diversified by allocating to a variety of risk premia strategies constructed in a robust and realistic fashion. Diversification should be across asset classes, geographies, sectors, instruments and risk premia sources. Risk management in this space should take into account the dynamic nature of the strategies and consider the what-if scenarios that could cause one or more components of the portfolio to all point in one direction.
However, risk premia investing is not a panacea. It should not be the only midfielder on the team, and, given the lack of performance fees, the exposure can be built with several “players” that offer exposures to a variety of premia and markets. Investors should build a coherent midfield, with several components and strategies across the liquidity spectrum such as hedge funds, HY, insurance linked securities and private credit, to name a few. They should pay higher fees and stomach the illiquidity for genuinely diversifying, alpha generating strategies. For commoditised alternative betas, they should stick with risk premia.
References
[1] Returns for the Bloomberg Barclays US Treasuries TR (LUATTRUU) index from 30 September 1981 to 30 September 2020. Note that the vast majority of this return came in the early part of this sample, when US 10-year rates averaged over 8% and yields compressed from 15.8% to 6.5% in December 1999
[2] Bloomberg Barclays US Treasuries TR (LUATTRUU)
[3] Bloomberg Barclays Global Agg TR (LEGATRUU)
[4] Bloomberg Barclays Japan Aggregate, which is >90% government and government-related securities (I02913JP)
[5] Bloomberg Barclays Euro Aggregate Treasury Germany (LETGTREU Index)
[6] Ang, A., Goetzmann, W.N. and Schaefer, S., 2009. Evaluation of active management of the Norwegian government pension fund global report to the Norwegian Ministry of Finance
[7] Hutchinson, M.C. and O’Brien, J., 2019. Testing Futures Trading Strategy Assumptions. The Journal of Alternative Investments, 22(2), pp.47-63
[8] Albourne Partners Ltd, Dynamic Beta Notional AUM invested in Dynamic Beta Strategies – Survey Results, 1H 2020
[9] https://wholesale.banking.societegenerale.com/en/prime-services-indices/
[10] Source Bloomberg (GDDUWI)
[11] Source Bloomberg (HFRXGL)
[12] Albourne: Notional AUM Invested in Dynamic Beta Strategies – Survey Results, 1H 2020
[13] https://www.bloombergquint.com/business/a-200-billion-exotic-quant-trade-is-facing-existential-doubts
[14] Arnott, R., Harvey, C.R., Kalesnik, V. and Linnainmaa, J., 2019.
Alice’s adventures in factorland: Three blunders that plague factor investing. The Journal of Portfolio Management, 45(4), pp.18-36
[15] Note that there is still uncertainty amongst academics and market practitioners as to the nature of a given strategy:
Vatanen, K. and Suhonen, A., 2019. A Framework for Risk Premia Investing: Anywhere to Hide? Available at SSRN 3344586
[16] Fama & French factor definition, gross of fees, transaction costs and funding costs. https://mba.tuck.dartmouth.edu/pages/faculty/ken.french/data_library.html
[17] Book value does not include intangible assets such as patents, investments in R&D, IT systems, brands, business processes, or human capital
[18] For a selection of investors letters from August 2007 see here: https://bigpicture.typepad.com/comments/2007/08/dear-investor--.html
[19] https://ftalphaville.ft.com/2007/08/14/6553/goldman-this-is-not-a-rescue-so-what-is-it-then/
[20] https://www.pionline.com/hedge-funds/hfr-hedge-fund-industry-assets-rebound-74-q2
[21] Lempérière, Y., Deremble, C., Seager, P., Potters, M. and Bouchaud, J.P., 2014. Two centuries of trend following. arXiv preprint arXiv:1404.3274
DISCLAIMER
Article for information only. All content is created and published by CdR Capital SA. The views and opinions expressed in this article are those of the author(s). Information on this website is only directed at professional, institutional or qualified investors and is not suitable for retail investors. None of the material contained on this website is intended to constitute an offer to sell, or an invitation or solicitation of an offer to buy any product or service. Nothing in this website, or article, should be construed as investment, tax, legal or other advice.